


WHO THIS RESEARCH IS FOR
- Roofing contractors who want to time their marketing spend with actual demand.
- SEO agencies managing home improvement clients across multiple states.
- Marketing managers allocating seasonal budgets for local service businesses.
- Content strategists building editorial calendars for contractor websites.
KEY TAKEAWAYS
- There is no single “roofing season.” Peak search months range from March (Ohio) to August (North Carolina) depending on state.
- Relative search interest varies by up to 361% between peak and trough months (Virginia), based on Google Trends normalized data.
- Emergency keywords are one of the clearest commercial opportunities: average KD of 4.3 combined with $11.60 CPC — low competition, high value.
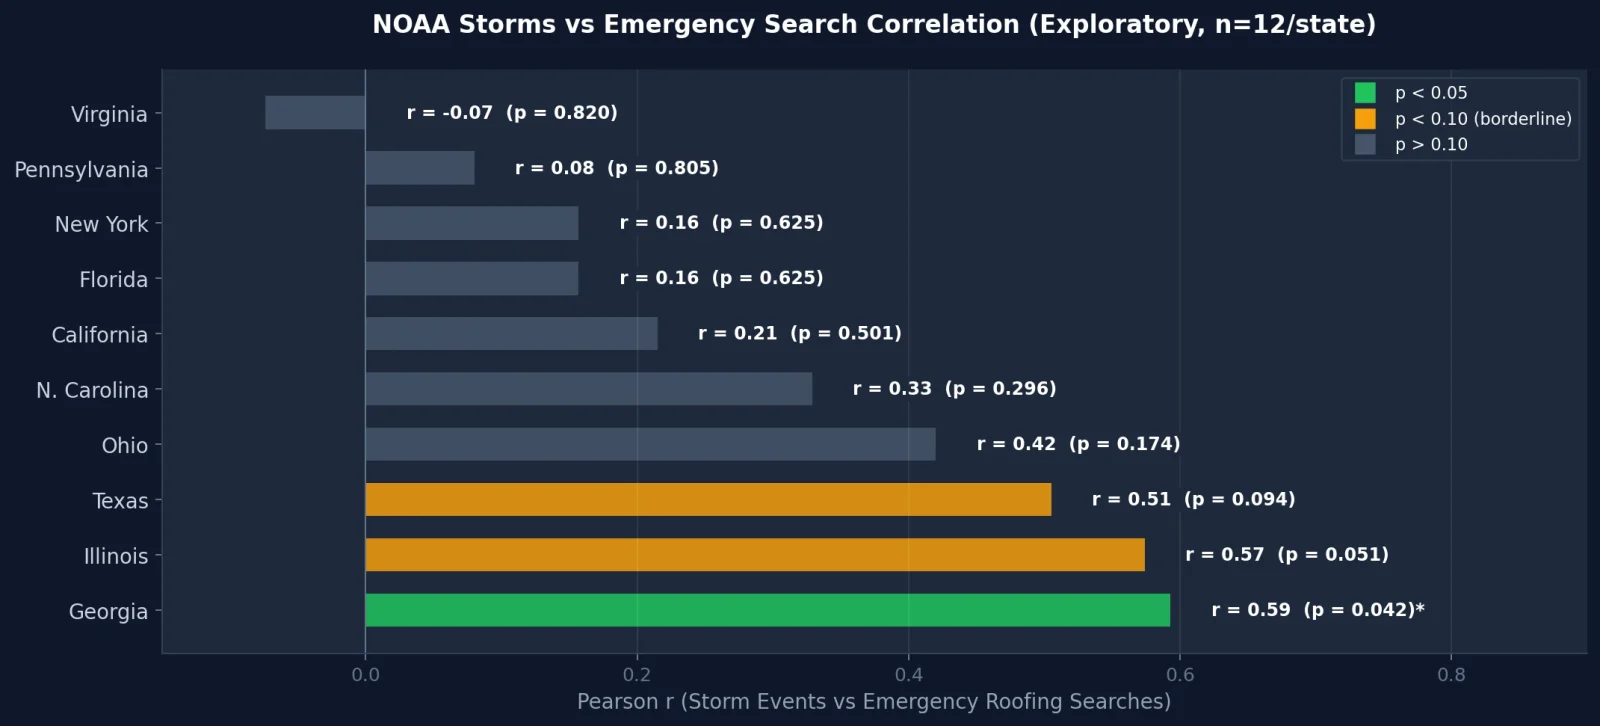
- Storm activity shows positive associations with roofing search demand in an exploratory analysis. Four states show individually significant Pearson correlations (p < 0.05) before multiple-comparison correction, though none survive Benjamini-Hochberg correction. In proactive states, search interest tends to peak before storm-event counts; in reactive states, after.
- Pennsylvania (+101.6% YoY) and North Carolina (+53.7%) are the fastest-growing markets in Ahrefs SV Trend data. Texas and Florida show YoY declines in Ahrefs SV Trend data.
- 5–7 page templates per state can cover the full keyword portfolio across our 10-state dataset, representing $4.2M–$7.2M in annual CPC-equivalent traffic value.
- Seasonal budget reallocation — concentrating ~60% of annual spend into 5 peak-adjacent months — can improve ROI potential.
Quick Reference: State Seasonal Summary
| State | Peak Month | Start Content | Best Keyword Type | YoY Trend |
| Texas | July | April | Emergency / Repair | −4.3% |
| Florida | July | April | Repair / Emergency | −5.6% |
| Georgia | April | January | Emergency / Local | +3.8% |
| California | April | January | Repair / Material | +23.2% |
| N. Carolina | August | May | Maintenance / Repair | +53.7% |
| Pennsylvania | July | April | Emergency / Planned | +101.6% |
| Virginia | April | January | Emergency / Repair | +28.1% |
| Ohio | March | December | Repair / Maintenance | +11.2% |
| Illinois | April | January | Maintenance / Repair | +29.0% |
| New York | April | January | Emergency / Planned | −18.8% |
HOW TO USE THIS RESEARCH
Roofing contractors: Find your state in the Quick Reference table. Start content 2–3 months before your peak month. Prioritize Emergency/Maintenance keywords — among the lowest-competition service-intent categories. Shift ~60% of budget into peak-adjacent months.
SEO agencies: Use state-by-state data, intent segmentation, and Easy Win analysis for roofing marketing strategies. The MEP section shows minimum page sets per state.
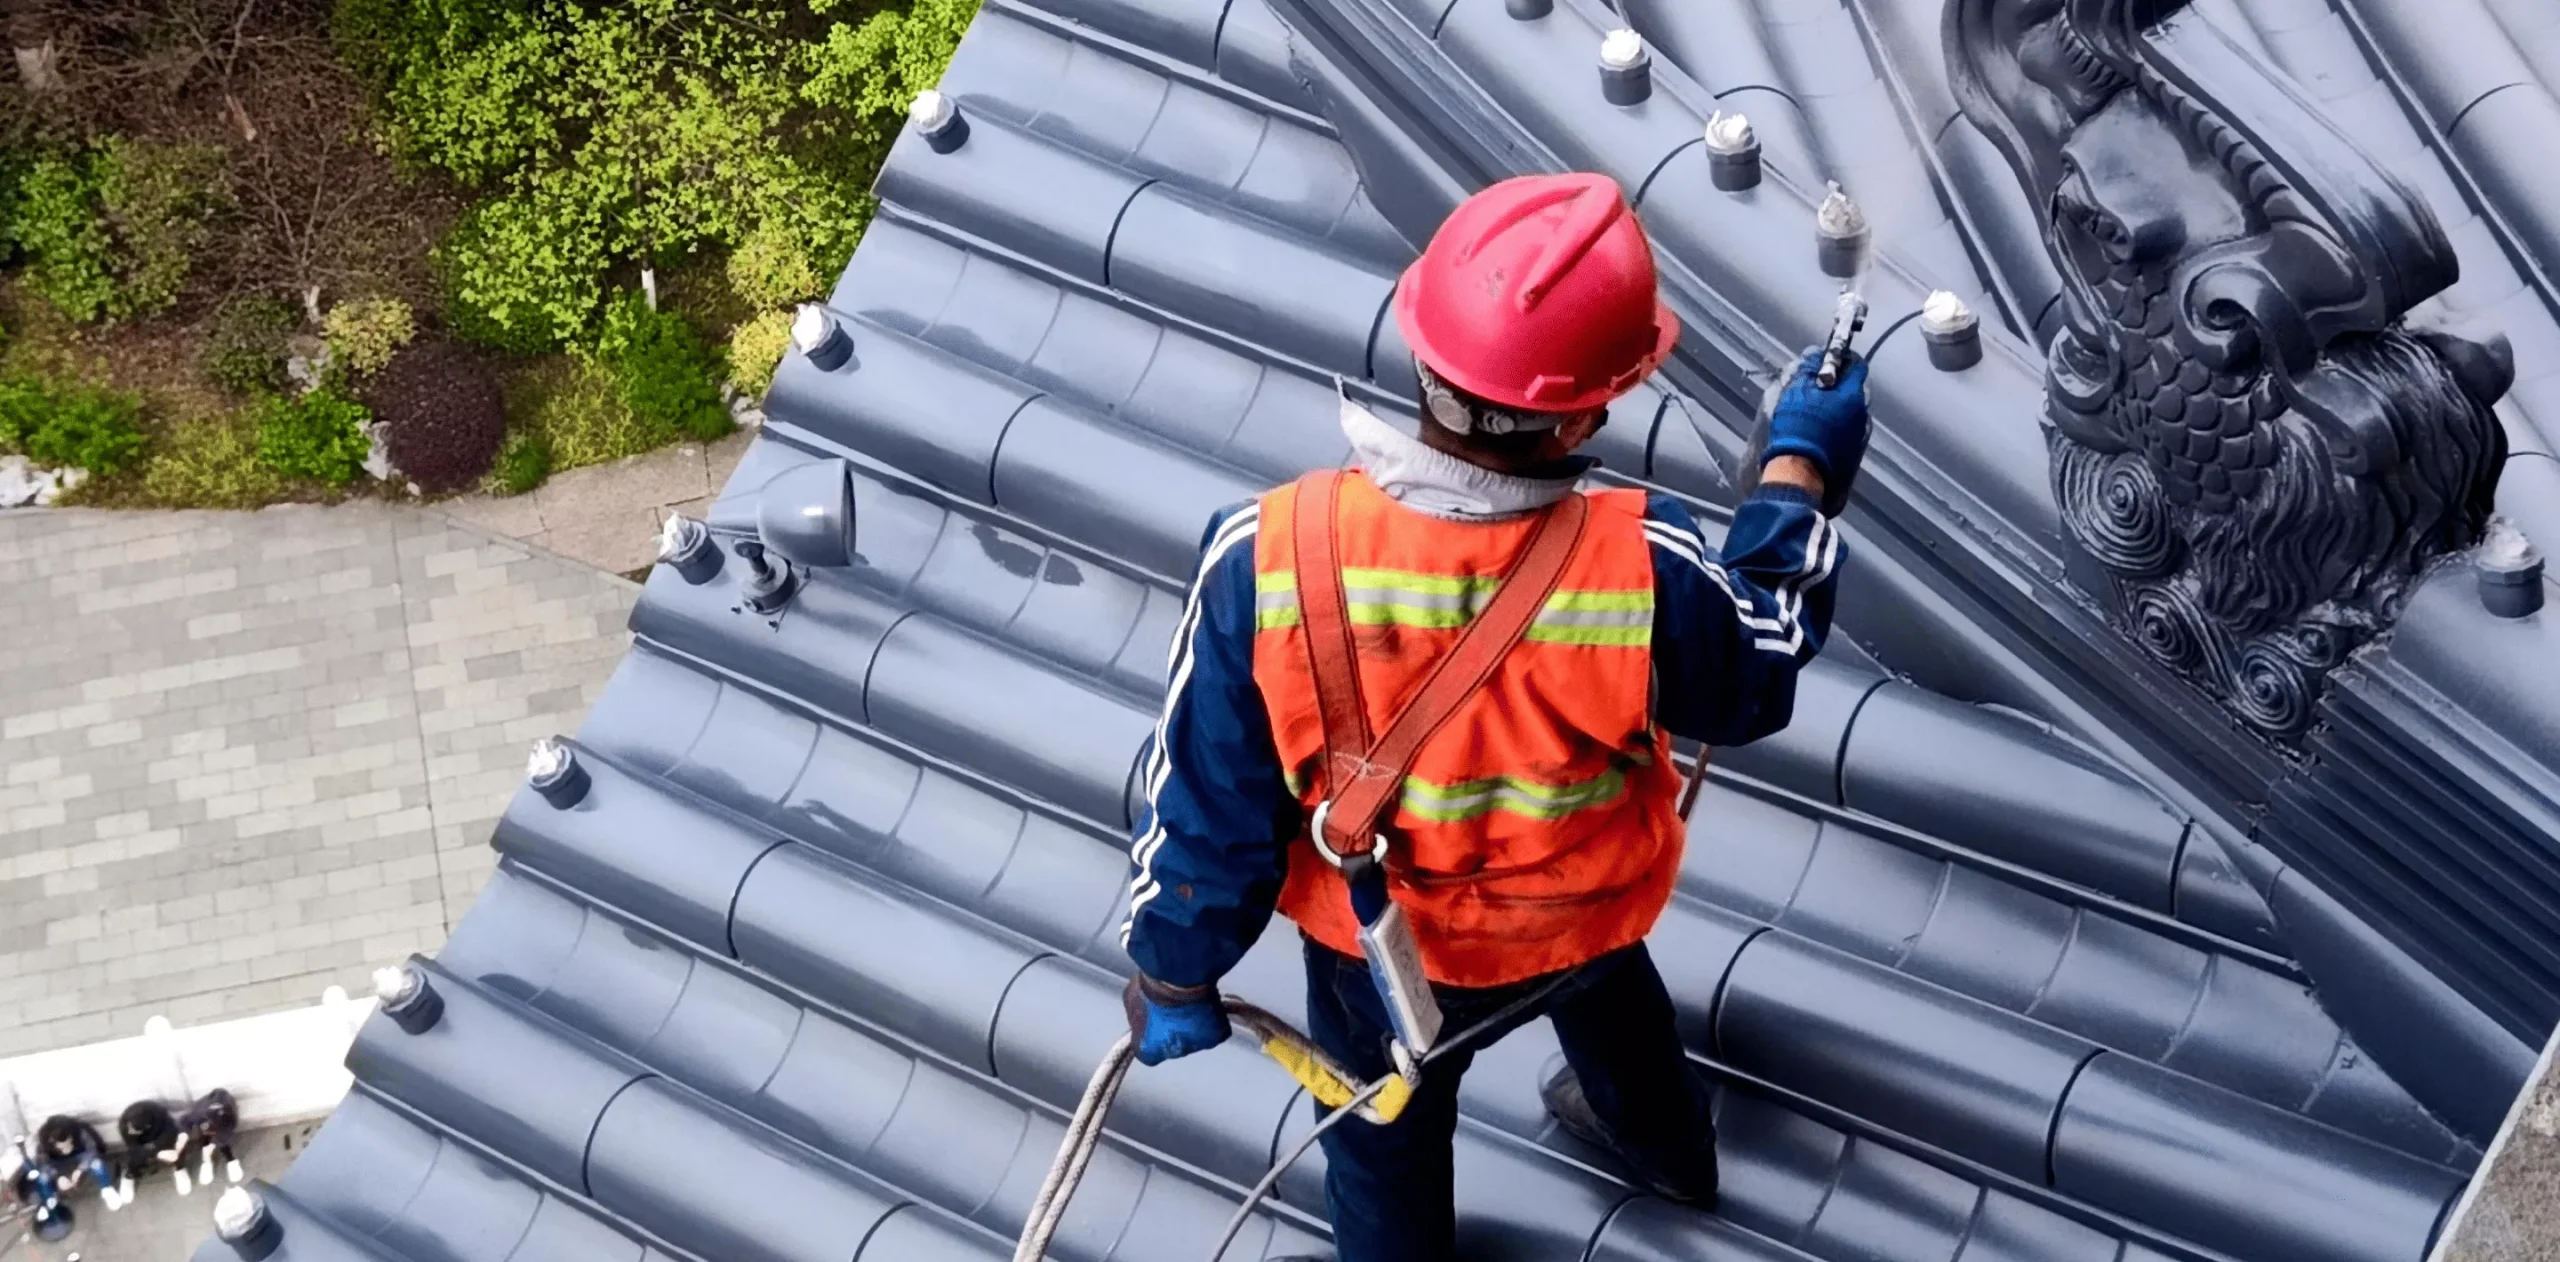
Introduction
If you run a roofing company in the United States, you already know that business is seasonal. Spring and summer bring more calls, more estimates, more jobs. Winter slows everything down.
But here is what most roofing contractors — and the agencies that serve them — get wrong: they treat roofing SEO strategy as a flat-rate, year-round activity. The same number of blog posts in January as in April. The same ad spend in December as in July. The same link-building cadence regardless of whether anyone is actually searching.
This approach can leave meaningful seasonal demand uncaptured.
We analyzed 800 roofing-related keywords across 10 U.S. states, cross-referenced with 12 months of Google Trends data (7,950 normalized data points) and 35,000+ storm events from NOAA’s Storm Events Database to answer a simple question: When exactly do homeowners search for roofers, and how should contractors time their SEO investments?
The results reveal a more nuanced seasonal pattern than national averages suggest — and they may reshape how you think about your marketing calendar.
Methodology
This research combines four independent data sources, processed through Google BigQuery:
| Data Source | What It Provides | Volume |
| Ahrefs Keywords Explorer | Search volume, keyword difficulty (KD), CPC for roofing keywords across 10 states | 957 raw → 800 deduplicated |
| Google Trends (pytrends API) | Normalized weekly search interest (0–100 scale) for 15 core keywords × 10 states × 12 months | 7,950 data points |
| Ahrefs SV Trend | 24-month relative search volume trend for year-over-year comparison | 346 keywords with full trend |
| NOAA Storm Events Database | Roof-damaging weather events (hail, wind, tornados, hurricanes) + reported property damage | 35,340 events (2024–2025) |
A Note on Google Trends Data
Google Trends reports normalized search interest on a 0–100 scale, where 100 represents the peak popularity of a term within the selected time period and geography. These values reflect relative search share, not absolute search volume. Throughout this article, when we refer to “search interest” or “interest scores,” we mean this normalized Google Trends metric. Absolute search volumes are drawn from Ahrefs and labeled explicitly. The 15 core keywords used for Google Trends analysis were: roof repair, roof replacement, roofing contractor, roofing company near me, roof inspection, roof leak repair, new roof cost, roof installation, metal roofing, roof replacement cost, emergency roof repair, roofing estimate, storm damage roof, roof coating, and roof cleaning.
Keyword Selection and Deduplication
We entered 20 seed keywords into Ahrefs Keywords Explorer as part of a keyword research process (Matching Terms, “Also rank for”) and applied three geographic Include filters (full state names, abbreviations, city names). After combining the three exports (957 raw keywords), we deduplicated by lowercased keyword + state, retaining the highest Volume for each pair. This produced 800 unique keyword–state combinations. No branded keywords were included.
Intent Classification Rules
Keywords were classified programmatically in BigQuery using regex pattern matching and search intent mapping.. Priority order: Emergency > Repair > Local > Planned > Research > Material > Maintenance > General. Keywords matching multiple patterns were assigned to the first match.
States Analyzed
We selected 10 states representing diverse climate zones, population densities, and roofing markets: Texas, Florida, California, New York, Georgia, North Carolina, Pennsylvania, Illinois, Ohio, and Virginia. These states account for approximately 48% of the U.S. population and cover the full spectrum of seasonal weather patterns — from hurricane-prone coasts to snow-belt interiors.
Key Metrics
- Seasonality Index — (Peak Month Interest / Average Interest) × 100 (based on Google Trends normalized scores). Values above 150 indicate meaningful seasonality; above 200 indicates extreme seasonal swings.
- Opportunity Score — (Volume / 1,000) × (1 − KD / 100) × (CPC + 1). We add 1 to CPC to avoid zero-value weighting for low-CPC terms. This is a proprietary heuristic, not an industry benchmark.
- Search Lag — The number of months between peak storm activity and peak search activity per state. Positive values indicate reactive search behavior; negative values indicate proactive behavior.
- Pearson Correlation (r) and Spearman Rank Correlation (ρ) — Statistical measures of relationship between monthly storm event counts and normalized search interest, reported with p-values. With n=12 monthly observations per state, a coefficient must exceed approximately ±0.58 to reach significance at the 95% confidence level.
How Search Lag Was Calculated
Search lag was computed as the difference (in months) between each state’s peak storm-event count month and its peak Google Trends roofing search interest month. Negative values indicate search interest peaked before storm activity; positive values indicate it peaked after. This is a simple peak-to-peak comparison, not a cross-correlation or lag analysis.
Data Collection Dates
- Ahrefs export: May 28, 2026
- Google Trends pull: May 29, 2026 (“today 12-m” ≈ Jun 2025–May 2026)
- NOAA files: Accessed May 29, 2026 (2024–2025 data)
- Ahrefs SV Trend period: May 2024–April 2026 (24 months)
Statistical Rigor and Limitations
All correlations in this study are reported with p-values from both Pearson (linear) and Spearman rank (monotonic) correlation tests. We only describe a relationship as “statistically significant” when p < 0.05. Where correlations do not reach significance, we state this explicitly.
Important caveats: With n=12 (monthly data points per state), our statistical power is limited. Correlation does not imply causation — observed associations between storm events and search behavior may reflect shared seasonality rather than direct causal links. We report raw (uncorrected) p-values and additionally applied Benjamini-Hochberg (BH) correction across the 10 state-level Pearson tests. Because no correlation survived BH correction at FDR = 0.05, the correlation analysis should be interpreted as exploratory. Weekly-level analysis (using our 7,950 raw data points) could yield more robust results and is a direction for future research.
NOAA event type filters: We included 15 roof-damaging event types: Hail, Thunderstorm Wind, Tornado, Hurricane/Typhoon, Tropical Storm, Tropical Depression, High Wind, Strong Wind, Heavy Rain, Flash Flood, Flood, Ice Storm, Heavy Snow, Blizzard, and Winter Storm. Other event types were excluded.On NOAA data: The NOAA Storm Events Database is the most comprehensive public source for U.S. severe weather records. However, NOAA notes that different event types have different recording periods, and damage estimates are self-reported by local Weather Forecast Offices with varying levels of completeness. Research has documented inconsistencies in property damage reporting across jurisdictions. We use this data to identify broad seasonal patterns, not precise dollar-value comparisons between states.
National Roofing Search Seasonality
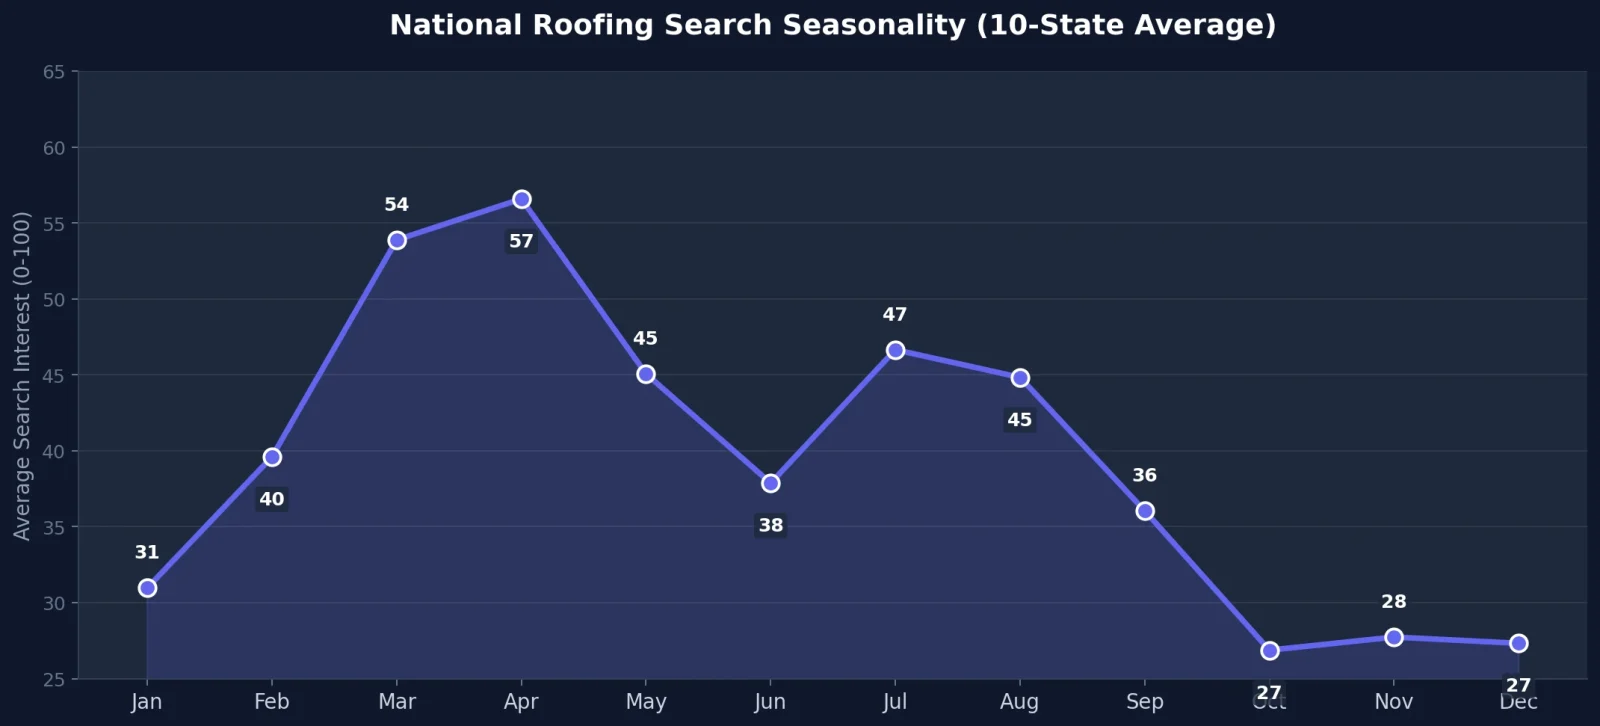
Averaged across all 10 states, roofing search demand follows a bimodal pattern with two distinct peaks:
- Spring peak (March–April): Search interest rises sharply as homeowners emerge from winter, inspect post-winter damage, and plan spring renovation projects.
- Summer peak (July): A second surge driven by storm-season activity, hurricane preparation, and active construction season in northern states.
- Trough (October–December): Search interest drops by 35–45% relative to peak levels, as construction season winds down and homeowners shift attention to holidays.
However, the national average masks dramatic state-level differences. A marketing strategy based on national trends would misfire in at least half of these states.
State-by-State Seasonality Analysis

| State | Keywords | Total SV | Avg KD | Avg CPC | Peak Month | Seas. Index | Opportunity |
| Texas | 199 | 38,850 | 18.4 | $7.78 | July | 187 | 295 |
| Florida | 164 | 29,450 | 19.8 | $9.48 | July | 193 | 256 |
| Georgia | 86 | 14,100 | 16.9 | $10.22 | April | 298 | 122 |
| California | 57 | 12,700 | 22.8 | $8.43 | April | 201 | 92 |
| N. Carolina | 72 | 12,850 | 10.6 | $7.78 | August | 300 | 92 |
| Virginia | 57 | 8,350 | 14.7 | $11.01 | April | 361 | 92 |
| Pennsylvania | 41 | 9,000 | 16.4 | $10.66 | July | 263 | 90 |
| Ohio | 36 | 7,200 | 18.0 | $10.81 | March | 323 | 75 |
| Illinois | 51 | 8,100 | 14.0 | $8.59 | April | 300 | 64 |
| New York | 37 | 5,300 | 15.9 | $8.46 | April | 283 | 43 |
Four distinct seasonal clusters emerge:
Cluster 1: Summer Peak States (Texas, Florida, Pennsylvania)
These states see their highest search interest in July, driven by active storm seasons and peak construction activity. Texas and Florida dominate in absolute volume (38,850 and 29,450 combined monthly searches respectively), making them the highest-value markets. Pennsylvania follows the same pattern due to its severe summer thunderstorm season.
Cluster 2: Spring Peak States (Georgia, California, Virginia, Illinois, New York)
Five states peak in April, driven by post-winter inspections and spring renovation planning. Virginia has the most extreme seasonality index (361), meaning its peak-to-trough swing is larger than any other state we studied. This makes timing especially critical for Virginia-based contractors.
Cluster 3: Early Spring Peak (Ohio)
Ohio peaks earliest — in March — as homeowners respond to post-winter roof damage. Ohio’s severe winters create immediate repair demand once temperatures rise, giving contractors there a head start on the season. Content published in December–January can capture demand by March.
Cluster 4: Late Summer Peak (North Carolina)
North Carolina peaks in August, driven by hurricane preparation and mid-summer storm activity. This is the latest peak among our 10 states, giving NC contractors more calendar time to prepare seasonal content. However, it also means the window between content publication and peak demand is narrower if you start late.
Search Interest Heatmap
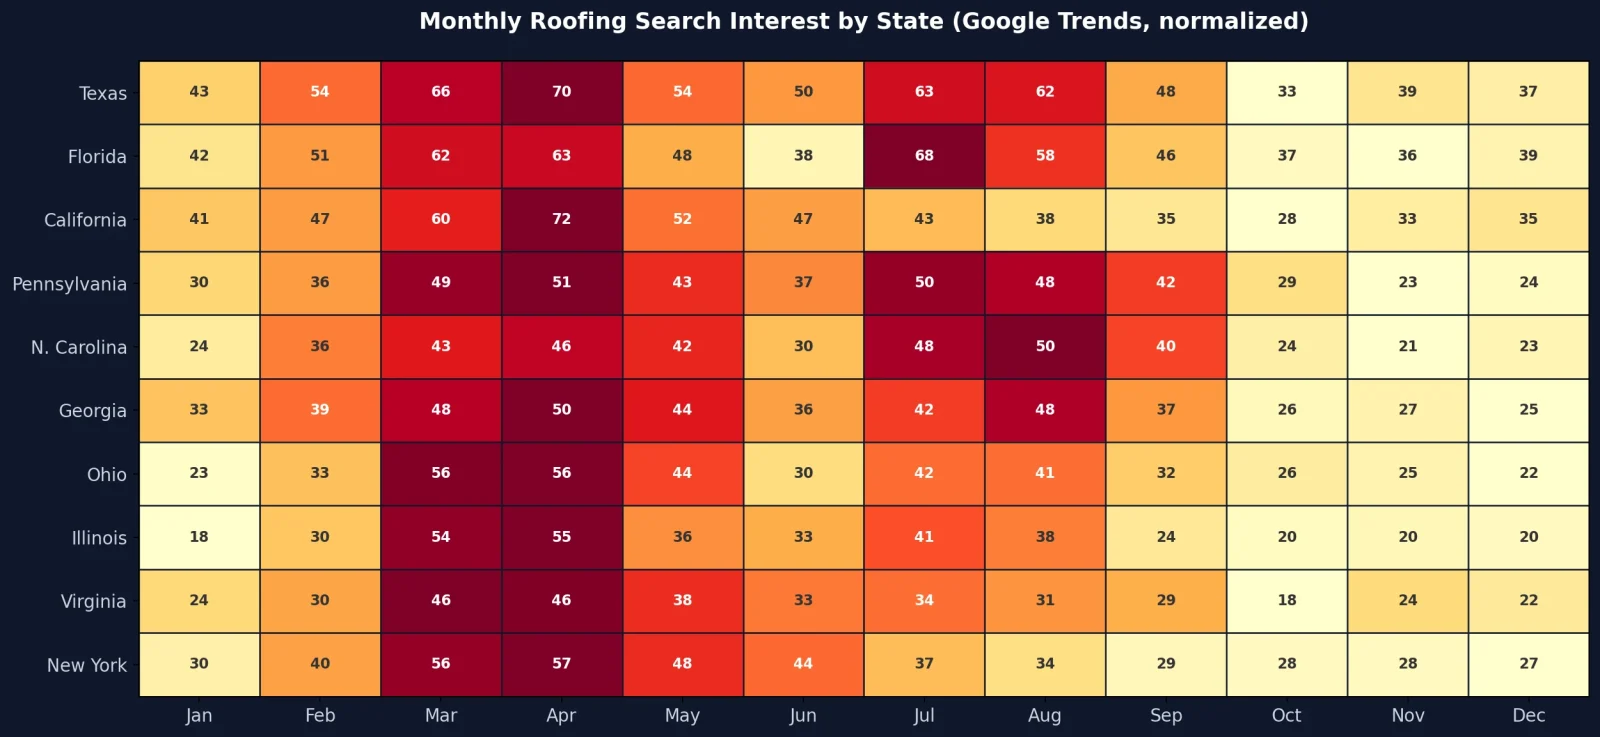
The heatmap reveals that there is no single “roofing season.” While most states show elevated demand from March through August, the intensity and timing vary substantially. California’s interest drops off sharply after April, while Florida sustains elevated interest through September. Pennsylvania shows an unusually broad distribution with sustained interest from April through August.
Weather-Search Correlation: How Storm Activity Aligns With Roofing Searches
To examine whether storm activity is associated with roofing search demand, we compared NOAA’s Storm Events Database (hail, thunderstorm winds, tornados, hurricanes, and other roof-damaging events) with monthly Google Trends search interest.
| State | Pearson r | p-value | Raw p < 0.05? | Spearman ρ | p-value | Pattern |
| Illinois | 0.680 | 0.015 | Yes | 0.720 | 0.008 | Proactive |
| Georgia | 0.652 | 0.022 | Yes | 0.581 | 0.047 | Proactive |
| Ohio | 0.627 | 0.029 | Yes | 0.685 | 0.014 | Same month |
| N. Carolina | 0.603 | 0.038 | Yes | 0.685 | 0.014 | Reactive |
| Pennsylvania | 0.555 | 0.061 | Borderline | 0.651 | 0.022 | Proactive |
| Texas | 0.415 | 0.180 | No (linear) | 0.657 | 0.020 | Proactive |
| Virginia | 0.231 | 0.471 | No | 0.497 | 0.100 | Proactive |
| Florida | 0.133 | 0.680 | No | 0.098 | 0.762 | Reactive |
| New York | 0.190 | 0.555 | No | 0.336 | 0.285 | Proactive |
| California | 0.088 | 0.785 | No | 0.098 | 0.762 | Reactive |
Interpretation (exploratory): Four states show statistically significant Pearson correlations (p < 0.05) between storm activity and roofing searches: Illinois, Georgia, Ohio, and North Carolina. Texas and Pennsylvania show significant Spearman correlations, suggesting a non-linear but consistent relationship. Florida, California, New York, and Virginia show no significant storm-search relationship in either test. After Benjamini-Hochberg correction across the 10 Pearson tests, none of these correlations remained significant at FDR = 0.05; we therefore treat them as exploratory timing signals.
Important: These correlations show association, not causation. Storm events and roofing searches may both follow seasonal patterns (e.g., both peak in spring) without storms directly causing searches. The practical value lies not in the causal mechanism but in the timing patterns contractors can use for planning.
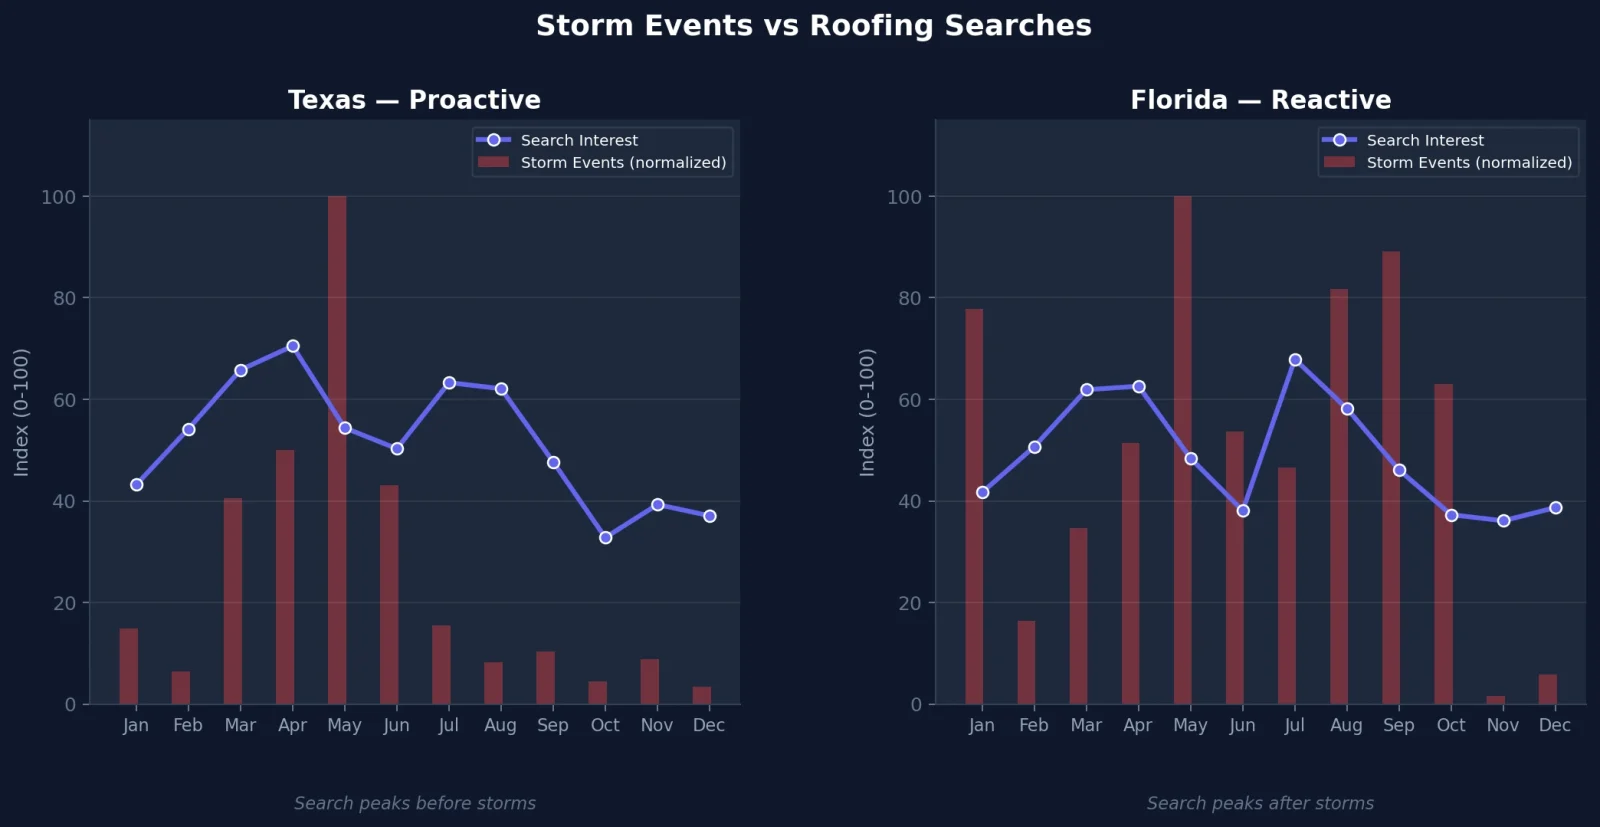
Proactive vs. Reactive Search Behavior
One of the most actionable findings is the search lag pattern — whether homeowners in a given state tend to search for roofers before or after peak storm season:
- Proactive states (6/10): Texas, Georgia, Illinois, New York, Pennsylvania, Virginia. Search interest rises 1–4 months before storm peaks. This may indicate homeowners are planning ahead — scheduling inspections, getting estimates, and preparing before severe weather arrives.
- Reactive states (3/10): Florida, North Carolina, California. Search interest peaks after storm events. In Florida, the largest reported property damage occurs in September, but search interest does not peak until the following spring. North Carolina shows a similar delayed pattern.
- Same-month (1/10): Ohio. Storm peaks and search peaks coincide in spring, suggesting immediate response to weather events.
What this means for contractors: In proactive states, your content needs to be indexed and ranking before storm season begins. In reactive states, you need sustained visibility through and after the storm season, as demand comes in waves rather than a single spike.
Year-over-Year Market Trends
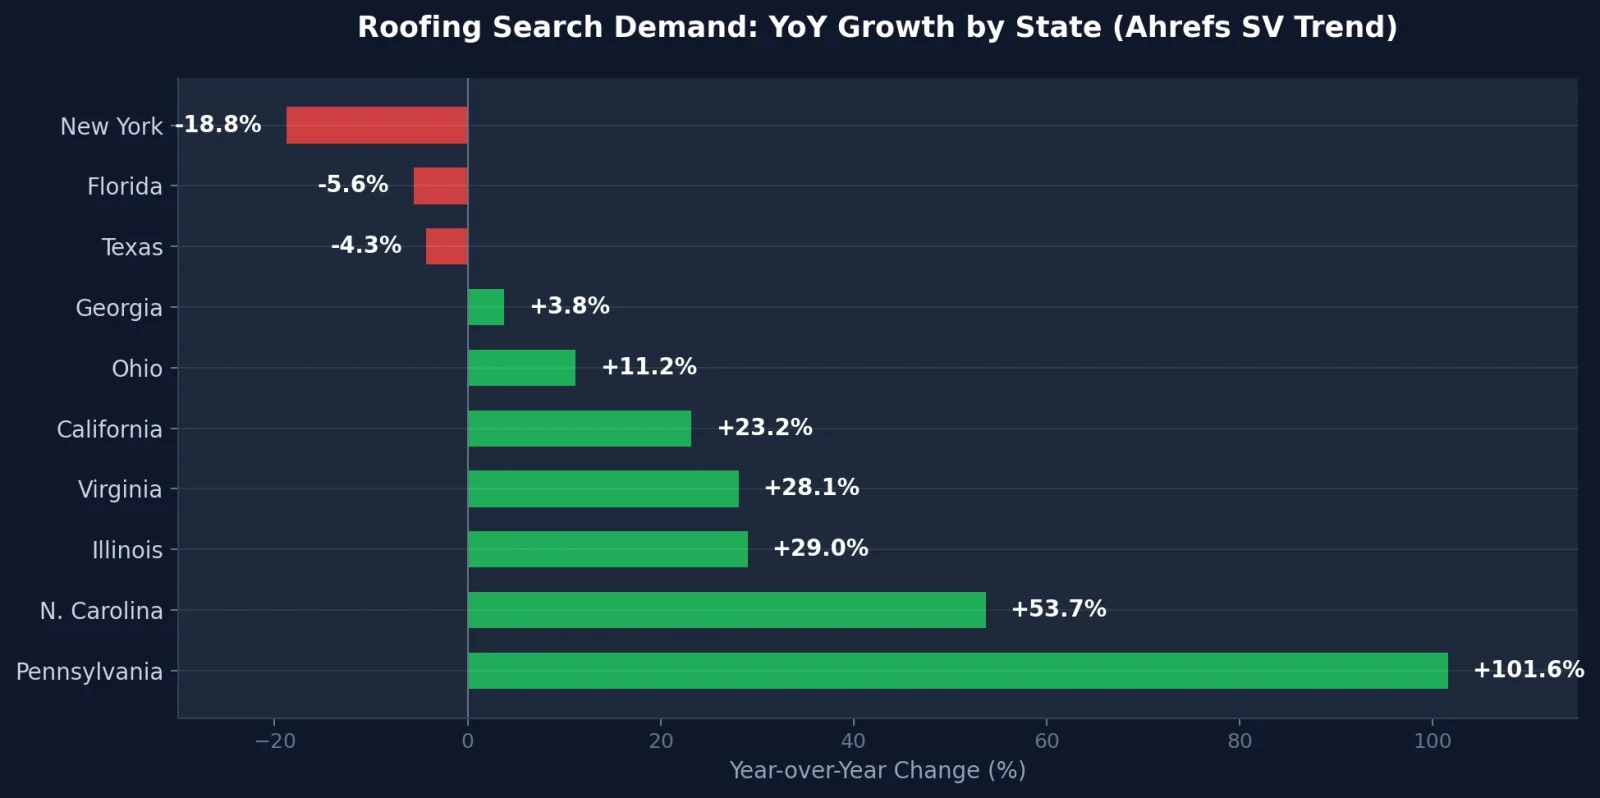
YoY change was calculated as the percentage difference between summed Ahrefs SV Trend values for May 2025–April 2026 vs. May 2024–April 2025, across 346 keywords with complete 24-month trend data. The roofing search market is not growing uniformly. Some states are experiencing significant demand growth while others are contracting:
| State | YoY Change | Growing | Declining | Trend |
| Pennsylvania | +101.6% | 14/16 | 2 | Explosive growth |
| N. Carolina | +53.7% | 23/29 | 6 | Strong growth |
| Illinois | +29.0% | 14/19 | 5 | Solid growth |
| Virginia | +28.1% | 17/22 | 5 | Solid growth |
| California | +23.2% | 23/31 | 8 | Moderate growth |
| Ohio | +11.2% | 12/21 | 9 | Moderate |
| Georgia | +3.8% | 19/33 | 14 | Flat |
| Texas | −4.3% | 50/101 | 51 | Declining |
| Florida | −5.6% | 40/69 | 29 | Declining |
| New York | −18.8% | 2/5 | 3 | Declining |
Pennsylvania’s +101.6% growth is the standout finding. Nearly every roofing keyword in the state is growing. Possible contributing factors include aging housing stock, severe weather exposure, and insurance-related demand, though this requires further validation. For agencies, Pennsylvania represents a high-growth market with relatively low competition (avg KD: 16.4).
Conversely, Texas and Florida — the two largest roofing markets by absolute search volume — are showing year-over-year declines. This may reflect market saturation, post-event demand normalization, or year-to-year volatility in storm-driven searches.
Search Intent Segmentation
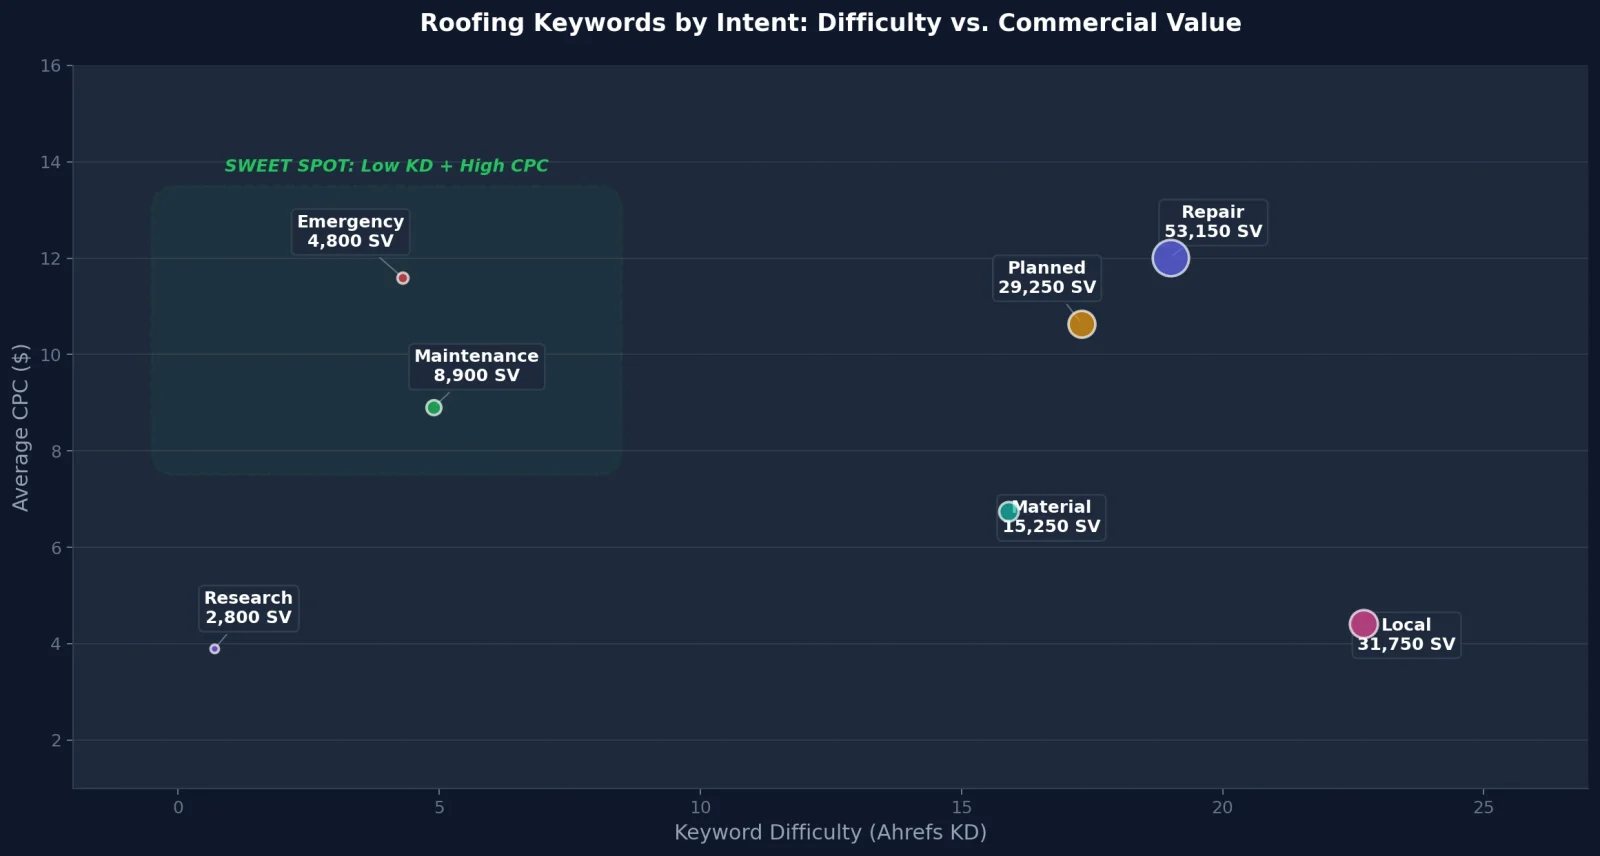
We classified all 800 keywords into seven intent categories:
| Intent | KWs | Total SV | Avg KD | Avg CPC | Takeaway |
| Repair | 272 | 53,150 | 19.0 | $12.01 | Largest category; moderate competition |
| Local | 182 | 31,750 | 22.7 | $4.41 | High volume but low CPC; brand-building |
| Planned | 166 | 29,250 | 17.3 | $10.64 | High-ticket; strong commercial intent |
| Material | 83 | 15,250 | 15.9 | $6.74 | Metal roofing trending; niche but growing |
| Maintenance | 55 | 8,900 | 4.9 | $8.91 | Very low KD — easy to rank |
| Emergency | 23 | 4,800 | 4.3 | $11.60 | Low KD + high CPC = strong early ROI potential |
| Research | 19 | 2,800 | 0.7 | $3.89 | Easiest to rank; top-of-funnel |
The most notable finding: emergency keywords have one of the lowest Ahrefs KD scores among commercial-intent categories (4.3) combined with high CPC ($11.60). This is uncommon in SEO — typically, high-value keywords attract high competition. The explanation is that most roofing companies focus their SEO on generic terms (“roofing contractor”) rather than emergency-specific content (“emergency roof repair [city]”), creating a gap that smaller, faster-moving companies can exploit.
Easy Win Opportunities
We scored all 800 keywords on an Easy Win formula combining volume, low difficulty, high CPC, seasonality strength, and year-over-year growth:
| Win Type | Count | Definition | Example Action |
| Quick Win | 95 | KD ≤ 10, Volume ≥ 200. Near-zero backlink competition per Ahrefs KD. | Publish optimized page, build 5–10 links |
| High-Value | 108 | CPC ≥ $15, KD ≤ 30. Expensive traffic achievable organically. | Comprehensive service page + local schema |
| Rising Star | 33 | KD ≤ 15, YoY > +20%. Growing demand, limited competition. | First-mover advantage; publish now |
| Seasonal QW | 27 | Low KD + Seasonality Index ≥ 200. Time-sensitive opportunity. | Publish 2–3 months before state peak |
Among the most valuable Easy Wins:
- “emergency roof repair san diego” (CA) — Volume 300, KD 0 (near-zero backlink competition per Ahrefs), CPC $17.
- “gutter installation pittsburgh” (PA) — Volume 500, KD 0, CPC $16. In the fastest-growing state (+101.6% YoY).
- “roof leak repair orlando” (FL) — Volume 250, KD 0, CPC $80. Extraordinarily high CPC indicates intense commercial intent.
- “roof repair raleigh” (NC) — Volume 400, KD 19, CPC $25. Rising Star in a +53.7% YoY growth market.
The 5-Step Seasonal Content Calendar
Based on the search lag analysis and seasonal patterns, we developed a 5-step framework that maps each state to a specific preparation timeline, working backwards from peak month:
| State | 1. Audit | 2. Content | 3. Links | 4. Paid | 5. Peak |
| Texas | Mar | Apr | May | Jun | Jul |
| Florida | Mar | Apr | May | Jun | Jul |
| Pennsylvania | Mar | Apr | May | Jun | Jul |
| Georgia | Dec | Jan | Feb | Mar | Apr |
| California | Dec | Jan | Feb | Mar | Apr |
| Virginia | Dec | Jan | Feb | Mar | Apr |
| Illinois | Dec | Jan | Feb | Mar | Apr |
| New York | Dec | Jan | Feb | Mar | Apr |
| Ohio | Nov | Dec | Jan | Feb | Mar |
| N. Carolina | Apr | May | Jun | Jul | Aug |
Phase Definitions
- Phase 1 — Audit (4 months before peak): Technical SEO audit, fix crawl errors, update existing pages, improve Core Web Vitals. This is maintenance work best done during low-demand months.
- Phase 2 — Content (3 months before peak): Publish new service pages, city-specific landing pages, and roofing content marketing assets targeting seasonal keywords. New content often needs lead time to be crawled, indexed, linked, and tested in search results.
- Phase 3 — Link Building (2 months before peak): Outreach campaigns, local citations, digital PR. Links typically take 4–8 weeks to influence rankings.
- Phase 4 — Paid Ramp-up (1 month before peak): Increase roofing Google Ads / Local Service Ads spend to complement organic visibility. Test ad copy and landing pages before maximum demand.
- Phase 5 — Peak Month: Maximum organic + paid visibility. Monitor rankings daily, respond to competitor moves, maximize conversion rates.
ROI Model: CPC-Equivalent Organic Traffic Value
Using average CPC data from Ahrefs and CTR benchmarks (31.7% for position #1, 18.6% for average top-3 position, based on widely-cited Backlinko/FirstPageSage studies), we estimated the equivalent Google Ads cost of organic roofing traffic for each state:
| State | Annual Value (Top 3) | Annual Value (#1) | Peak Month (#1) |
| Texas | $843K | $1.44M | $188K (Jul) |
| Florida | $779K | $1.33M | $182K (Jul) |
| Georgia | $402K | $685K | $148K (Apr) |
| California | $299K | $509K | $107K (Apr) |
| N. Carolina | $279K | $475K | $119K (Aug) |
| Pennsylvania | $268K | $456K | $62K (Jul) |
| Virginia | $257K | $437K | $96K (Apr) |
| Ohio | $217K | $370K | $77K (Mar) |
| Illinois | $194K | $331K | $57K (Apr) |
| New York | $125K | $213K | $44K (Apr) |
| TOTAL | $4.16M | $7.24M |
These values represent the estimated Google Ads equivalent cost of comparable organic traffic, not guaranteed revenue. Actual business value depends on conversion rates, service area overlap, and competitive positioning. However, the CPC-equivalent model is a common SEO method for estimating organic traffic value, and the relative differences between states and months are the actionable insight.
The peak-month numbers are particularly instructive. A Texas contractor ranking #1 for their keyword portfolio would receive an estimated $188,000 in CPC-equivalent organic traffic value in July alone — roughly double their off-season months.
Minimum Effective Portfolio (MEP)
Contractors do not need hundreds of pages to capture this value. Our analysis shows that 5–7 page types (or templates) per state can cover the full keyword portfolio through intent-based clustering. Actual page count depends on the number of cities served — a Local page template, for example, would be replicated for each target city:
| Page Topic | Intent | KWs Captured | Why It Works |
| Emergency Roof Repair in [State] | Emergency | 15–25 | Low KD + high CPC. Fastest SEO entry point. |
| Roof Repair Services in [State] | Repair | 50–100 | Largest keyword cluster. Core service page. |
| Roof Replacement & Installation | Planned | 30–60 | High-ticket. Longest, most comprehensive content. |
| Best Roofing Contractors in [City] | Local | 30–50 | Local pack + organic. City-specific versions. |
| Roof Replacement Cost in [State] | Research | 10–20 | Top-of-funnel. Builds trust, captures early leads. |
| Metal & Specialty Roofing | Material | 15–30 | Differentiation. Appeals to higher-budget homeowners. |
| Roof Inspection & Maintenance | Maint. | 10–20 | Lowest KD among service-intent categories. Good for new sites. |
For a Texas contractor, these 7 page types would map to all 199 keywords (38,850 monthly searches, $843K–$1.4M in annual CPC-equivalent value). The Local template alone may produce 3–10 city-specific pages depending on service area. For a smaller market like Ohio, 5 templates cover all 36 keywords.
The key insight is prioritization. Start with the Emergency and Maintenance pages (lowest KD), build authority and internal links, then tackle the higher-competition Repair and Local pages.
Budget Allocation Model
A flat monthly SEO budget ignores the seasonal demand swings documented in this research. Here is how a $58,000 annual Texas SEO budget (roughly $4,800/month) could be reallocated based on the data:
| Month | Demand | Phase | Budget | Focus |
| Jan | Low | Off-season | $2,500 | Technical audit, site speed |
| Feb | Rising | Off-season | $3,000 | Content planning, keyword mapping |
| Mar | Rising | Audit | $4,500 | Publish new pages, fix issues |
| Apr | Build-up | Content | $6,500 | Max content output, city pages |
| May | High | Links | $7,000 | Link building, outreach, PR |
| Jun | High | Paid ramp | $7,500 | Google Ads, Local Service Ads |
| Jul | PEAK | Max push | $8,000 | Full organic + paid + GBP optimization |
| Aug | High | Sustain | $6,000 | Monitor rankings, adjust bids |
| Sep | Declining | Wind down | $4,000 | Reduce paid, maintain organic |
| Oct | Low | Off-season | $3,500 | Collect reviews, case studies |
| Nov | Low | Off-season | $3,000 | Plan next year, update content |
| Dec | Low | Off-season | $2,500 | Technical maintenance |
Total annual spend remains $58,000 (equivalent to ~$4,833/month flat). The seasonal reallocation concentrates approximately 60% of budget into the 5 peak-adjacent months (April through August) where ROI potential is highest.
NOAA Storm Data: Emergency Search Correlation and Storm Damage Timing
Storm Damage Timing: The Florida Example
Florida experienced approximately $4.24 billion in reported roof-damaging storm property damage in September 2024–2025 — yet peak roofing searches occurred months earlier (March–April) and in a secondary summer peak (July). This disconnect between damage timing and search timing suggests that Florida homeowners may delay repairs, rely on insurance adjusters, or search under different terms after major hurricane events.
For contractors in high-damage states, this means maintaining year-round visibility is essential — homeowners may search weeks or months after the actual storm event.
Conclusion and Recommendations
The pattern is clear, with several important caveats noted throughout this research: seasonal timing is one of the biggest levers contractors can pull to improve their SEO ROI. Not the only lever — content quality, technical SEO, and backlink profiles still matter — but timing amplifies everything else.
Here are five actionable takeaways:
- Know your state’s peak month. It differs significantly: July for Texas/Florida/Pennsylvania, April for Georgia/California/Virginia/Illinois/New York, March for Ohio, August for North Carolina. Build your calendar backwards from your peak.
- Publish content 2–3 months before peak demand. New content often needs lead time to be crawled, indexed, linked, and tested in search results. Content published during peak season is generally too late to capture that season’s traffic.
- Prioritize Emergency and Maintenance keywords. These have some of the lowest competition among commercial-intent keywords (Ahrefs KD 4–5) and high CPC ($9–$12). They represent the fastest path to organic ROI.
- Reallocate your budget seasonally. Stop spending evenly. Concentrate approximately 60% of your annual SEO budget into the 5 months surrounding your peak. Use off-season months for technical work and content planning.
- Watch the growth markets. Pennsylvania (+101.6% YoY) and North Carolina (+53.7%) are the markets to watch. If you are looking to expand into a new state, these offer the strongest demand tailwinds.
This research analyzed a single vertical (roofing) across 10 states. The methodology — combining search data with weather data and statistical testing — can be applied to any home improvement category: HVAC, plumbing, solar, landscaping, and beyond.
Limitations of This Study
- Sample size for correlations: With n=12 monthly data points per state, statistical power is limited. Significant correlations should be viewed as indicative, not definitive.
- Google Trends normalization: Interest values are relative (0–100), not absolute. Comparisons between states reflect relative patterns, not absolute volume differences.
- NOAA data completeness: Storm damage figures are self-reported by local Weather Forecast Offices. Reporting standards and completeness vary by jurisdiction and event type.
- Correlation vs. causation: Observed associations between storms and searches may reflect shared seasonal patterns. We have not established causal direction.
- Multiple comparison correction: After Benjamini-Hochberg correction, no individual Pearson correlation remained significant. Raw p-values are reported for exploratory pattern detection, not definitive inference.
- ROI model assumptions: CPC-equivalent values assume Backlinko/FirstPageSage CTR benchmarks and current Ahrefs CPC data. Actual traffic value depends on conversion rates, competitive dynamics, and local market conditions.
- Time period: Google Trends covers June 2025–May 2026 (12 months). NOAA data covers 2024–2025. Year-to-year variation in weather patterns could shift seasonal peaks.
What This Does Not Mean
This research does not mean roofing companies should stop SEO during off-season months. Off-season is when technical fixes, content planning, page updates, and link acquisition should happen — so rankings are ready before demand peaks. Seasonal reallocation means shifting emphasis, not pausing activity.
Flat Budget vs. Seasonal Budget
| Flat SEO Budget | Seasonal SEO Budget |
| Same spend every month | Higher spend before and during demand peaks |
| Easier to manage and forecast | Better aligned with actual search behavior |
| Can miss seasonal demand windows | Aligns effort with peak demand windows |
| Consistent content cadence | Front-loads content before peak indexing window |
State Quick Playbooks
| State | Playbook Summary |
| Texas | Publish Apr, link-build May, paid Jun. Peak = Jul. Exploratory Spearman signal. |
| Florida | Year-round visibility. Prepare for Jul secondary peak and post-hurricane demand waves. |
| Pennsylvania | Fastest-growing (+101.6% YoY). Start content Apr, peak Jul. High untapped opportunity. |
| Georgia | Spring peak (Apr). Strong storm-search association in exploratory analysis. Start content Jan. |
| California | Apr peak, winter storm season. Focus on rain/wind keywords Dec–Mar. |
| Ohio | Earliest peak (Mar). Start content Dec. Post-winter damage drives immediate demand. |
| N. Carolina | Latest peak (Aug). May–Jul build-up. Hurricane-prep keywords strong. |
| Virginia | Highest Seasonality Index (361). Apr peak. Timing matters most here. |
| Illinois | Apr peak. Exploratory storm-search signal. Growing market (+29% YoY). |
| New York | Apr peak. Declining (−18.8%). Focus on low-KD emergency keywords. |
If You Can Only Build Three Pages First
- Emergency Roof Repair in [Your City] — KD 4.3 avg, CPC $11.60. Often low backlink competition, depending on city SERP.
- Roof Inspection & Maintenance in [Your State] — KD 4.9 avg. Lowest-competition service-intent category. Attracts pre-season leads.
- Roof Repair Services in [Your City] — Highest-volume category (53,150 total SV). City-level pages rank faster.
FAQ
01 When is the best time to start SEO for a roofing company?
It depends on your state. For July-peak states (TX, FL, PA), start intensive content in April. For April-peak states (GA, CA, VA, IL, NY), start in January. For Ohio (March peak), start in December. General rule: begin 3–4 months before your peak.
02 What are the easiest roofing keywords to rank for?
Emergency keywords (avg KD 4.3) and Maintenance keywords (avg KD 4.9) have the lowest competition among service-intent categories. Research keywords (KD 0.7) are easier still but have lower commercial value.
03 Do storms increase roofing searches?
Our exploratory analysis found positive associations in several states, but after Benjamini-Hochberg correction for multiple comparisons, no individual correlation reached significance. The patterns are suggestive but not conclusive.
04 Which states have the highest roofing SEO opportunity?
By Opportunity Score: Texas (295), Florida (256), Georgia (122). By growth: Pennsylvania (+101.6% YoY) and North Carolina (+53.7%).
05 How far before peak season should content be published?
3 months before peak. New pages need time to be crawled, indexed, linked, and tested in search results. Link building: 2 months before. Paid ads: 1 month before.
06 How should roofing companies allocate SEO budget seasonally?
Concentrate ~60% of annual budget into the 5 peak-adjacent months. Use off-season for technical audits, content planning, review collection, and site updates.
Love what you’re reading? Sign up for our newsletter to get our newest articles, helpful tips, and fresh marketing updates delivered right to you. No spam, just the good stuff.